
Dürr brings high automation and flexibility to Fujian Benz‘s assembly line

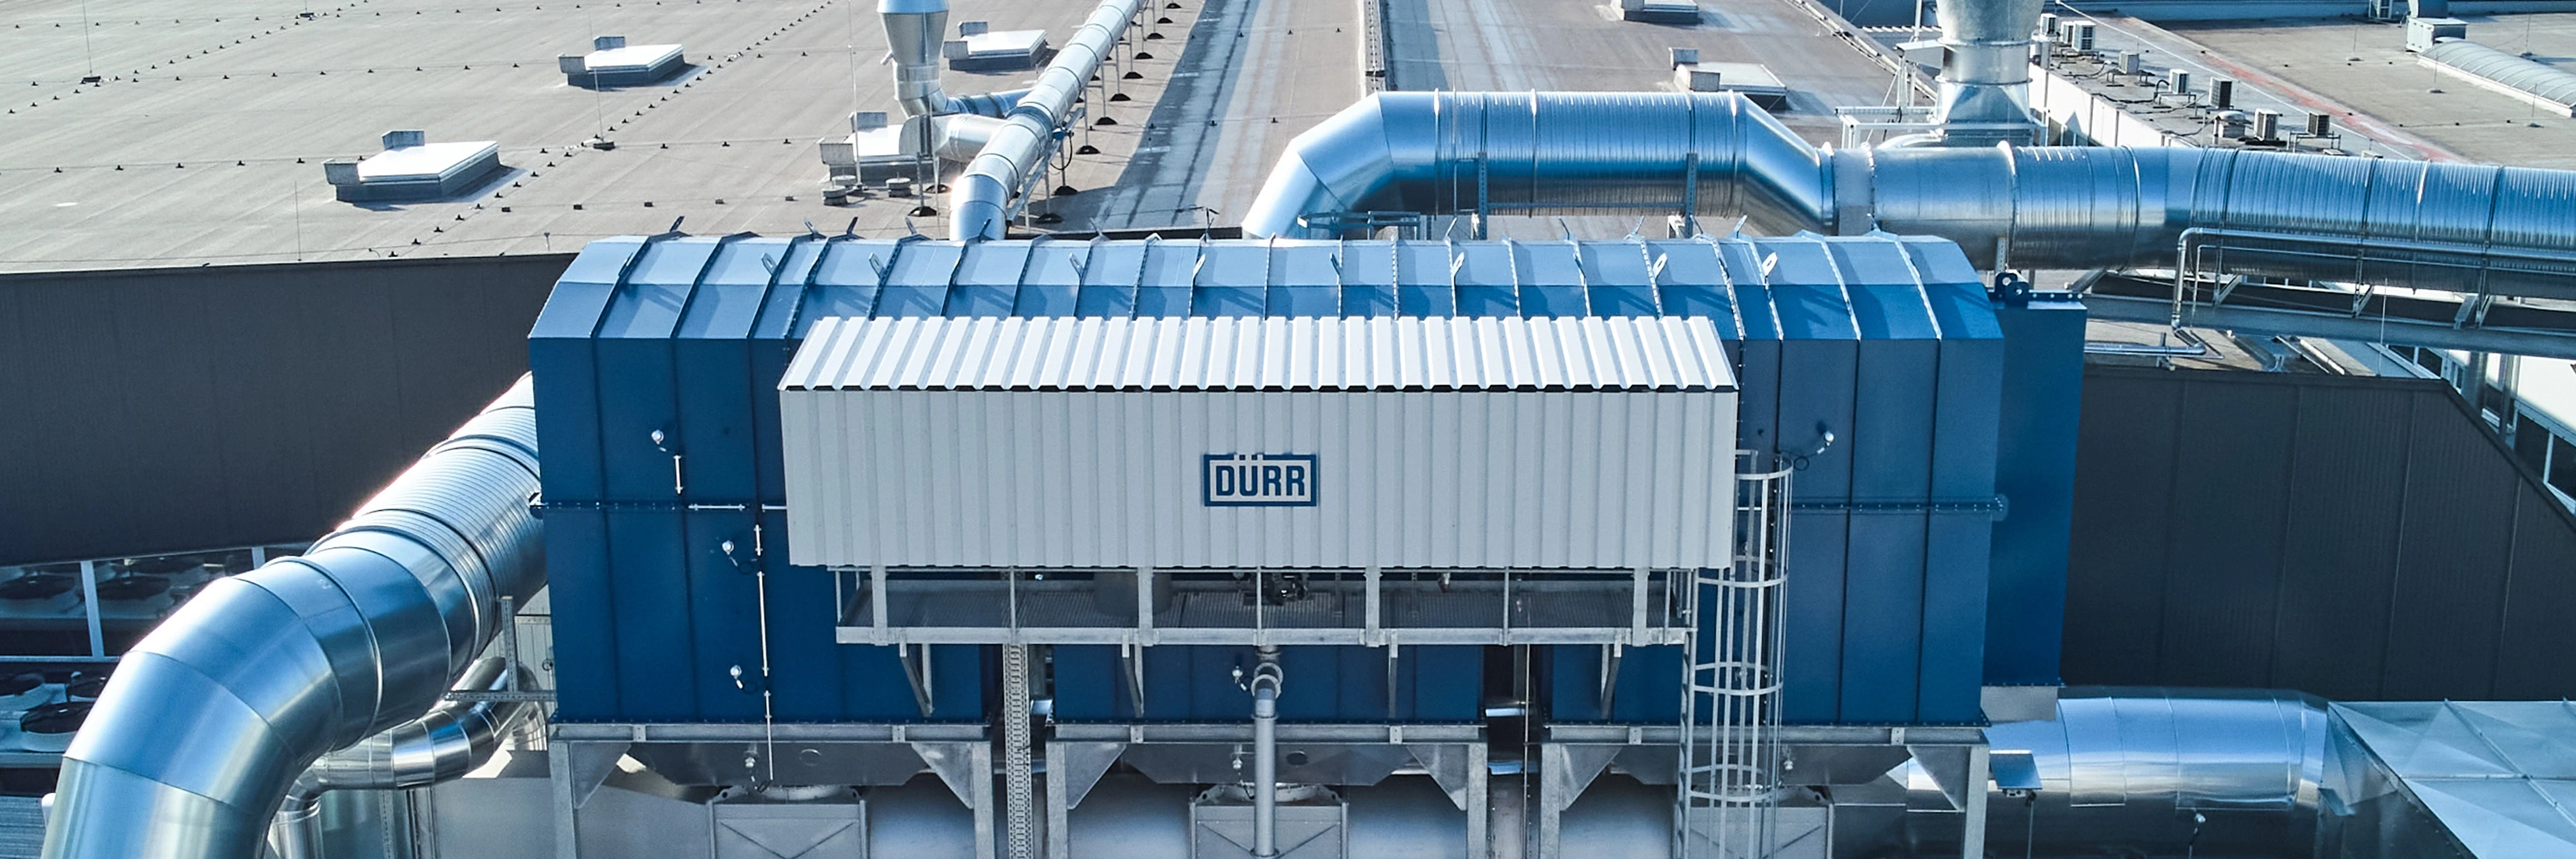
Energy-flexible drying: Dürr introduces Qflex technology

EcoRP4 with optimized arm geometry for all painting tasks

RoDip Eᶻᵞ increases flexibility in plant planning

The paint shop of the future – flexibility, sustainability, service

New Dürr EcoAUC2 control unit for fast integration and maximum flexibility
EcoNextJet prints custom designs on vehicle bodies
Interstuhl relies on Dürr products for seat surface coating
Sale of the environmental technology business
Since November 1, 2025, Dürr CTS has been operating as an independent environmental technology company. Click here to visit the new website.
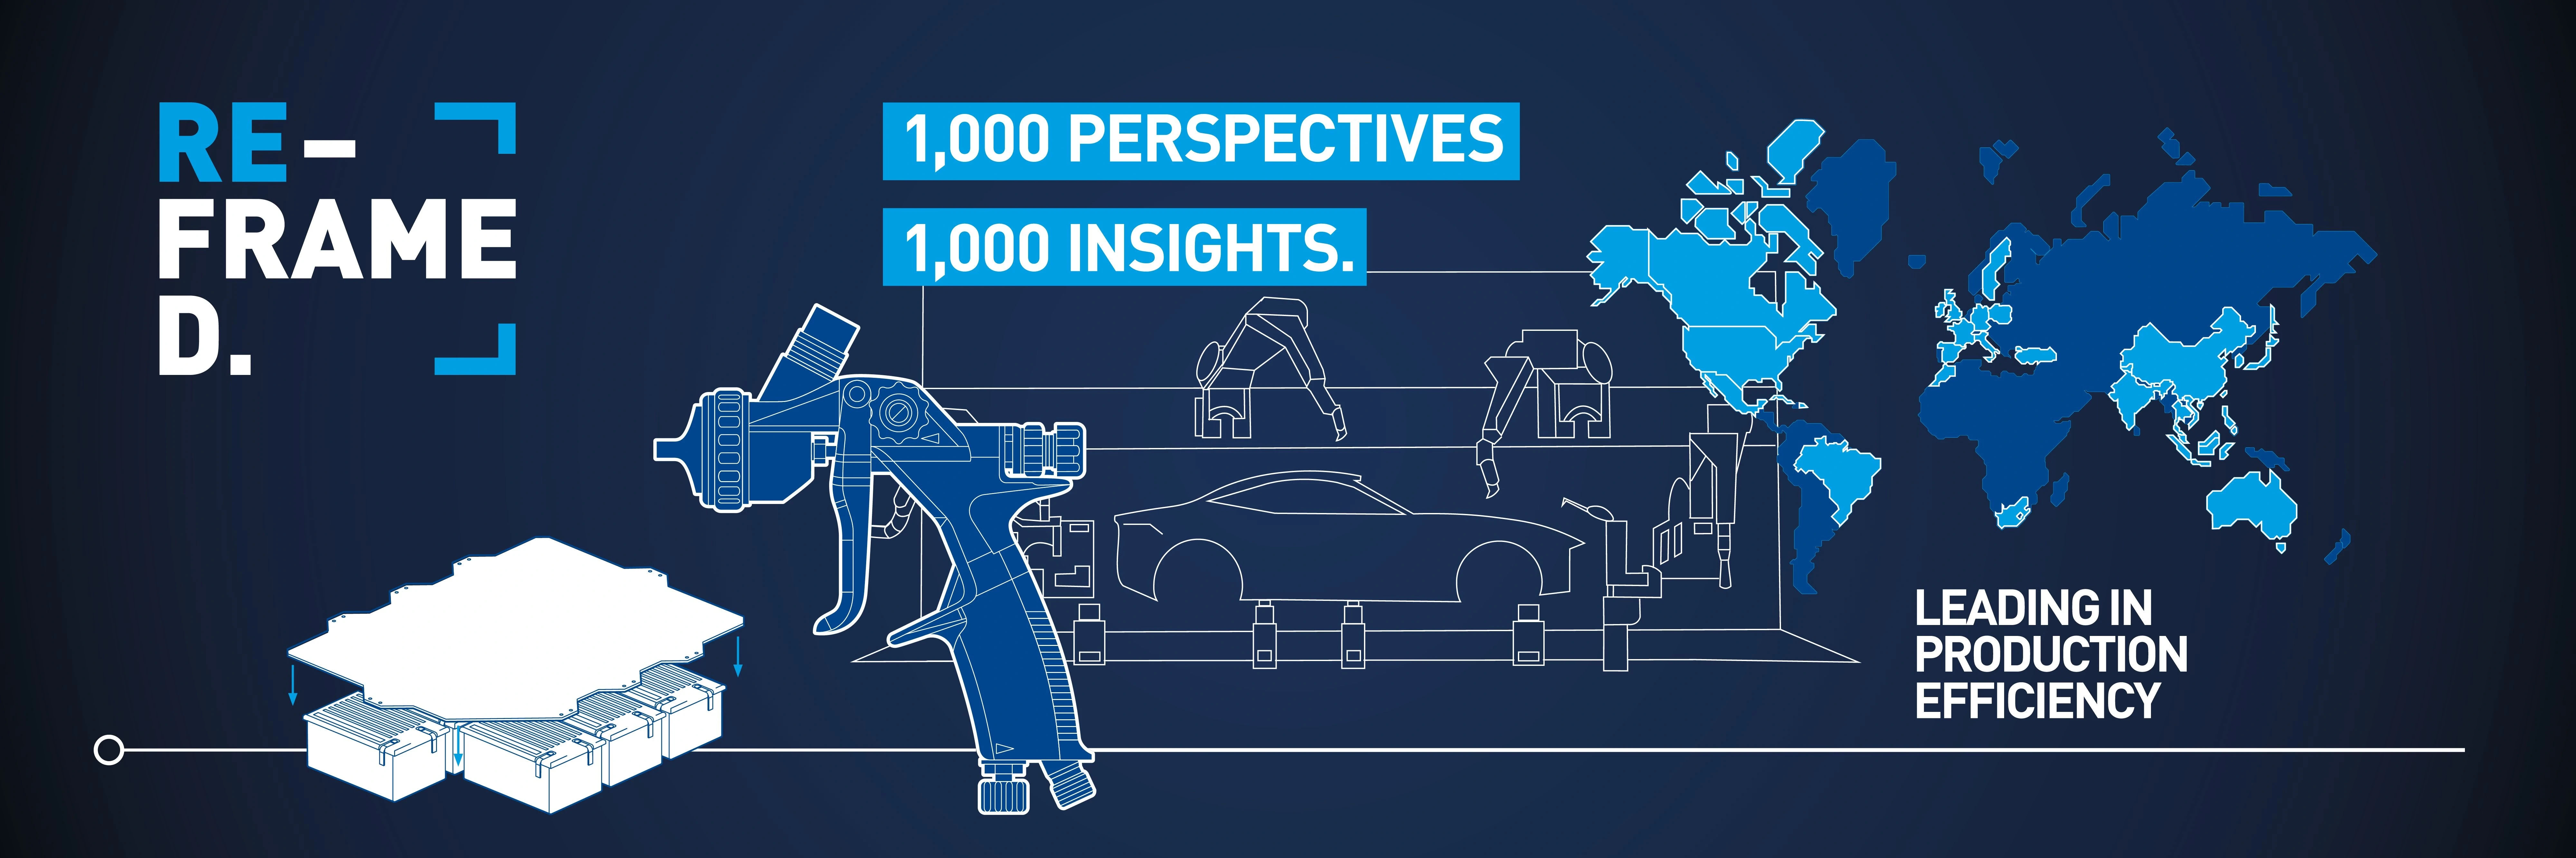
REFRAMED: the new online magazine of Dürr Systems AG
Find out more
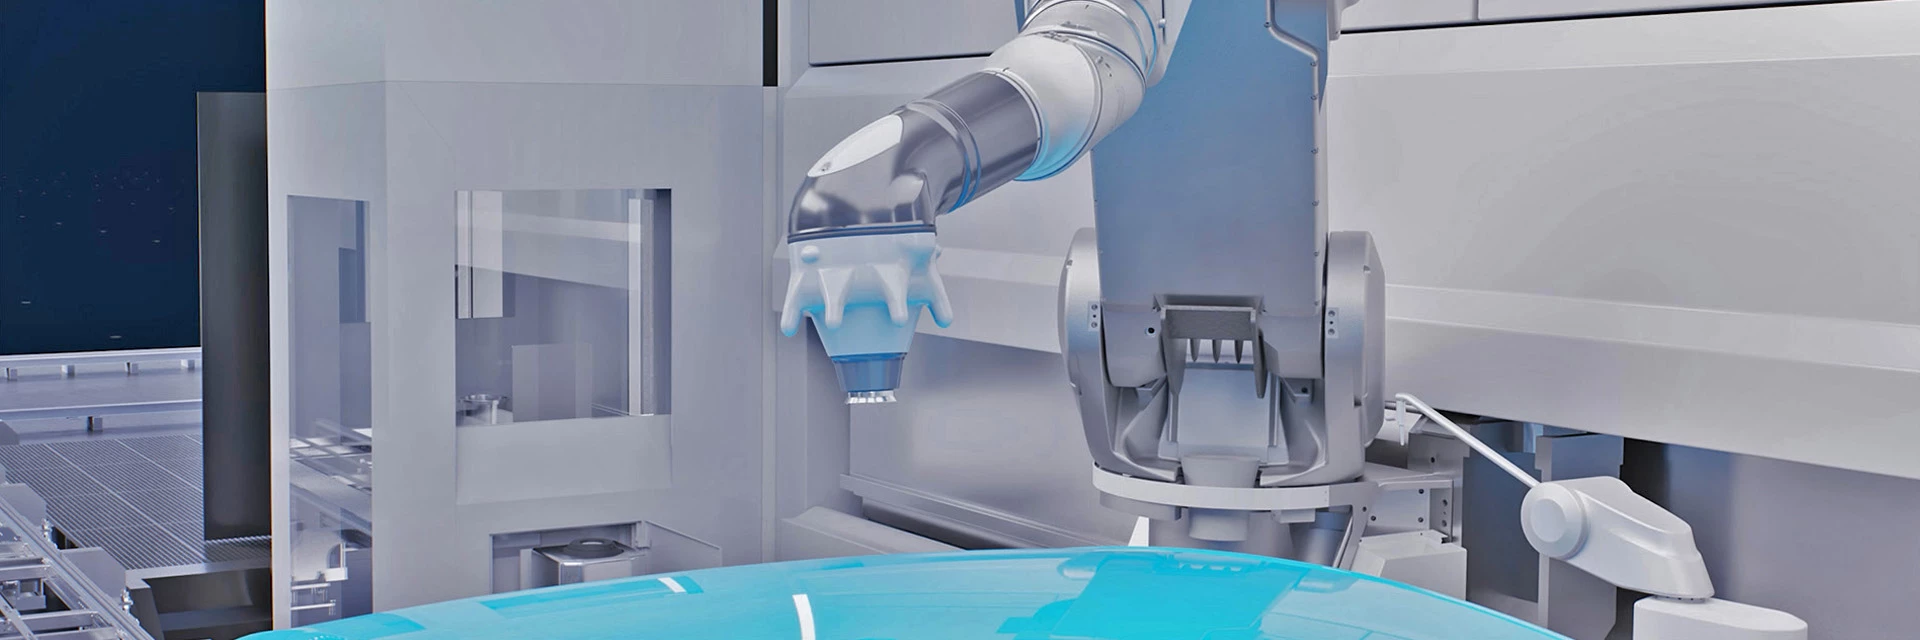
EcoBell4 Rotary atomizer
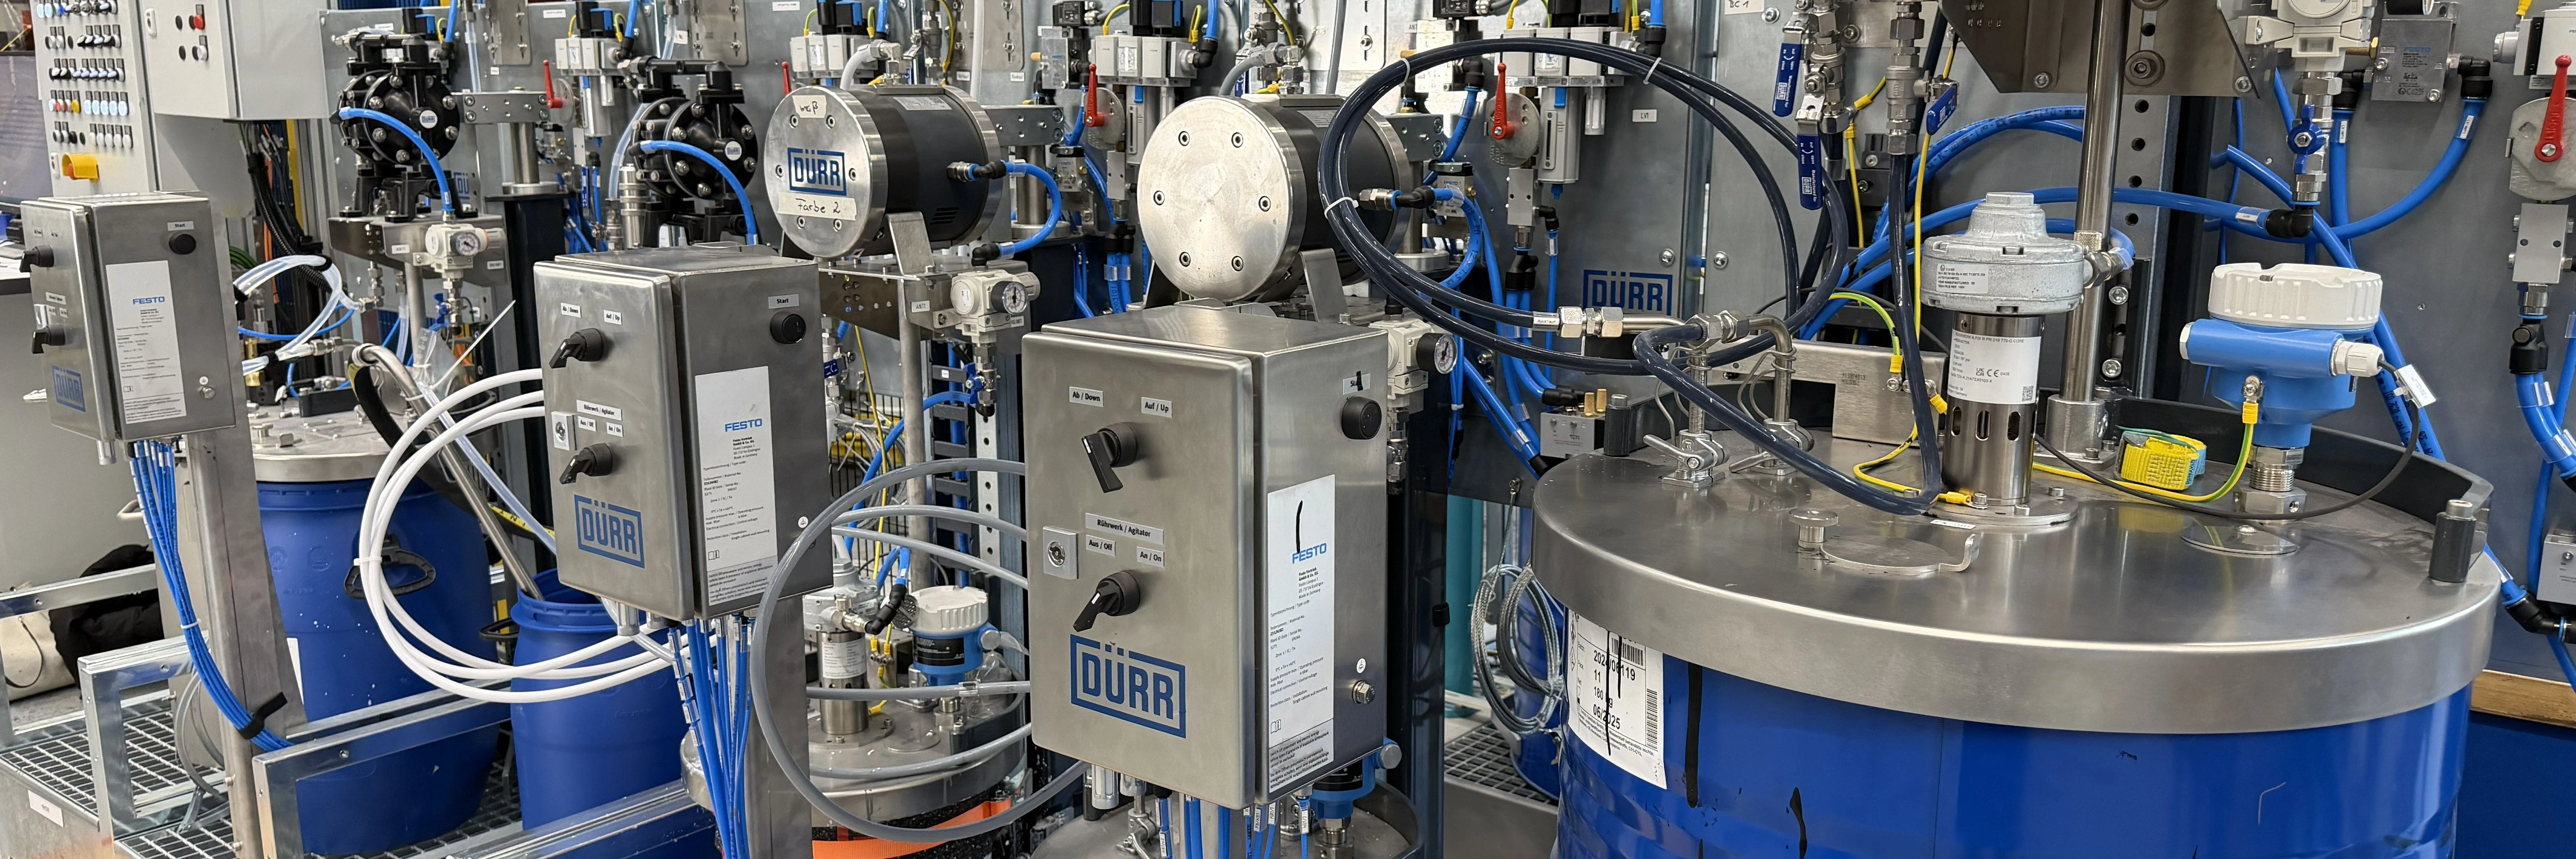
From green to red to yellow to blue.
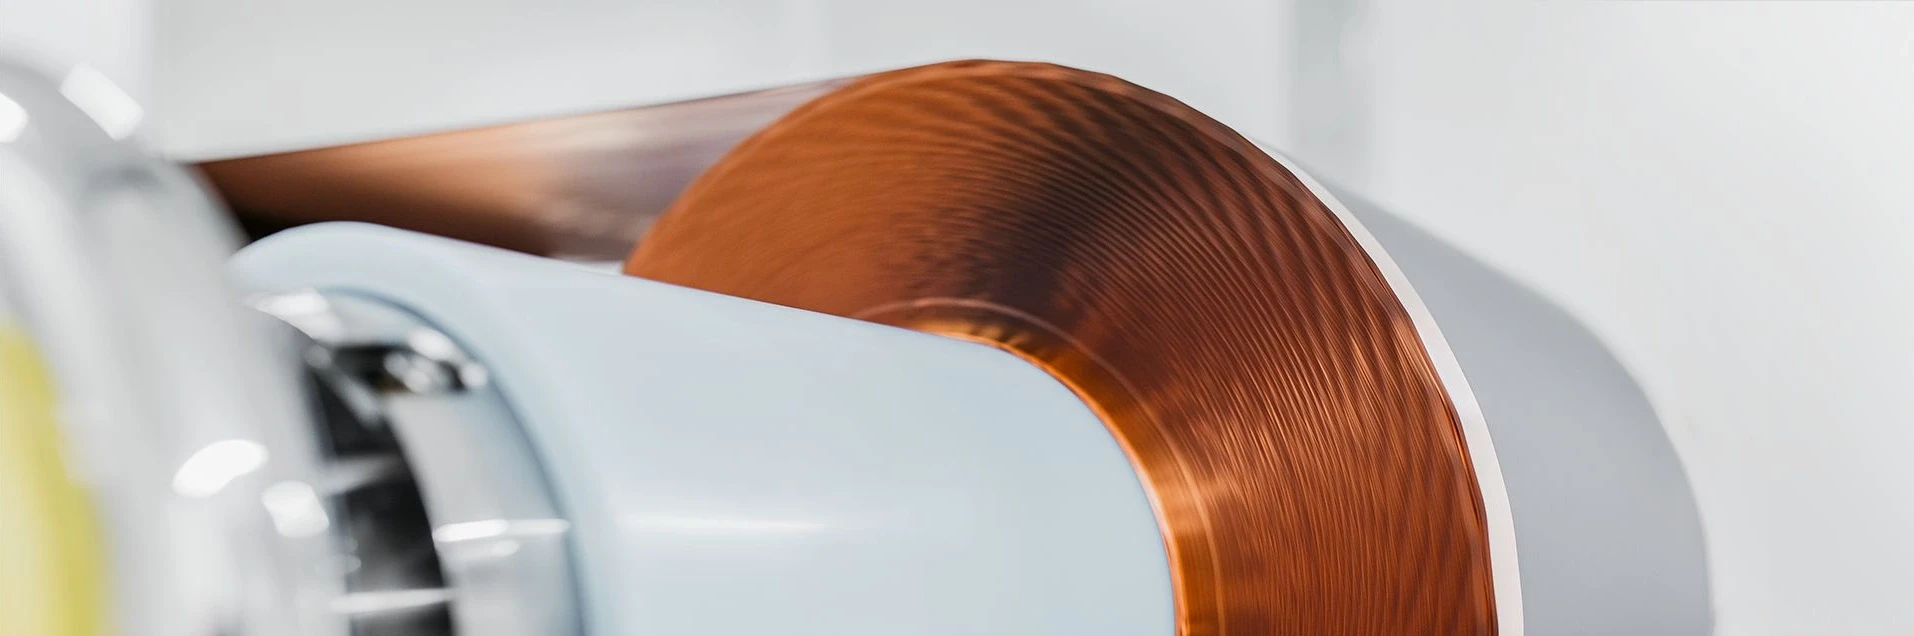
Electrode manufacturing
Highest quality from R&D to mass production
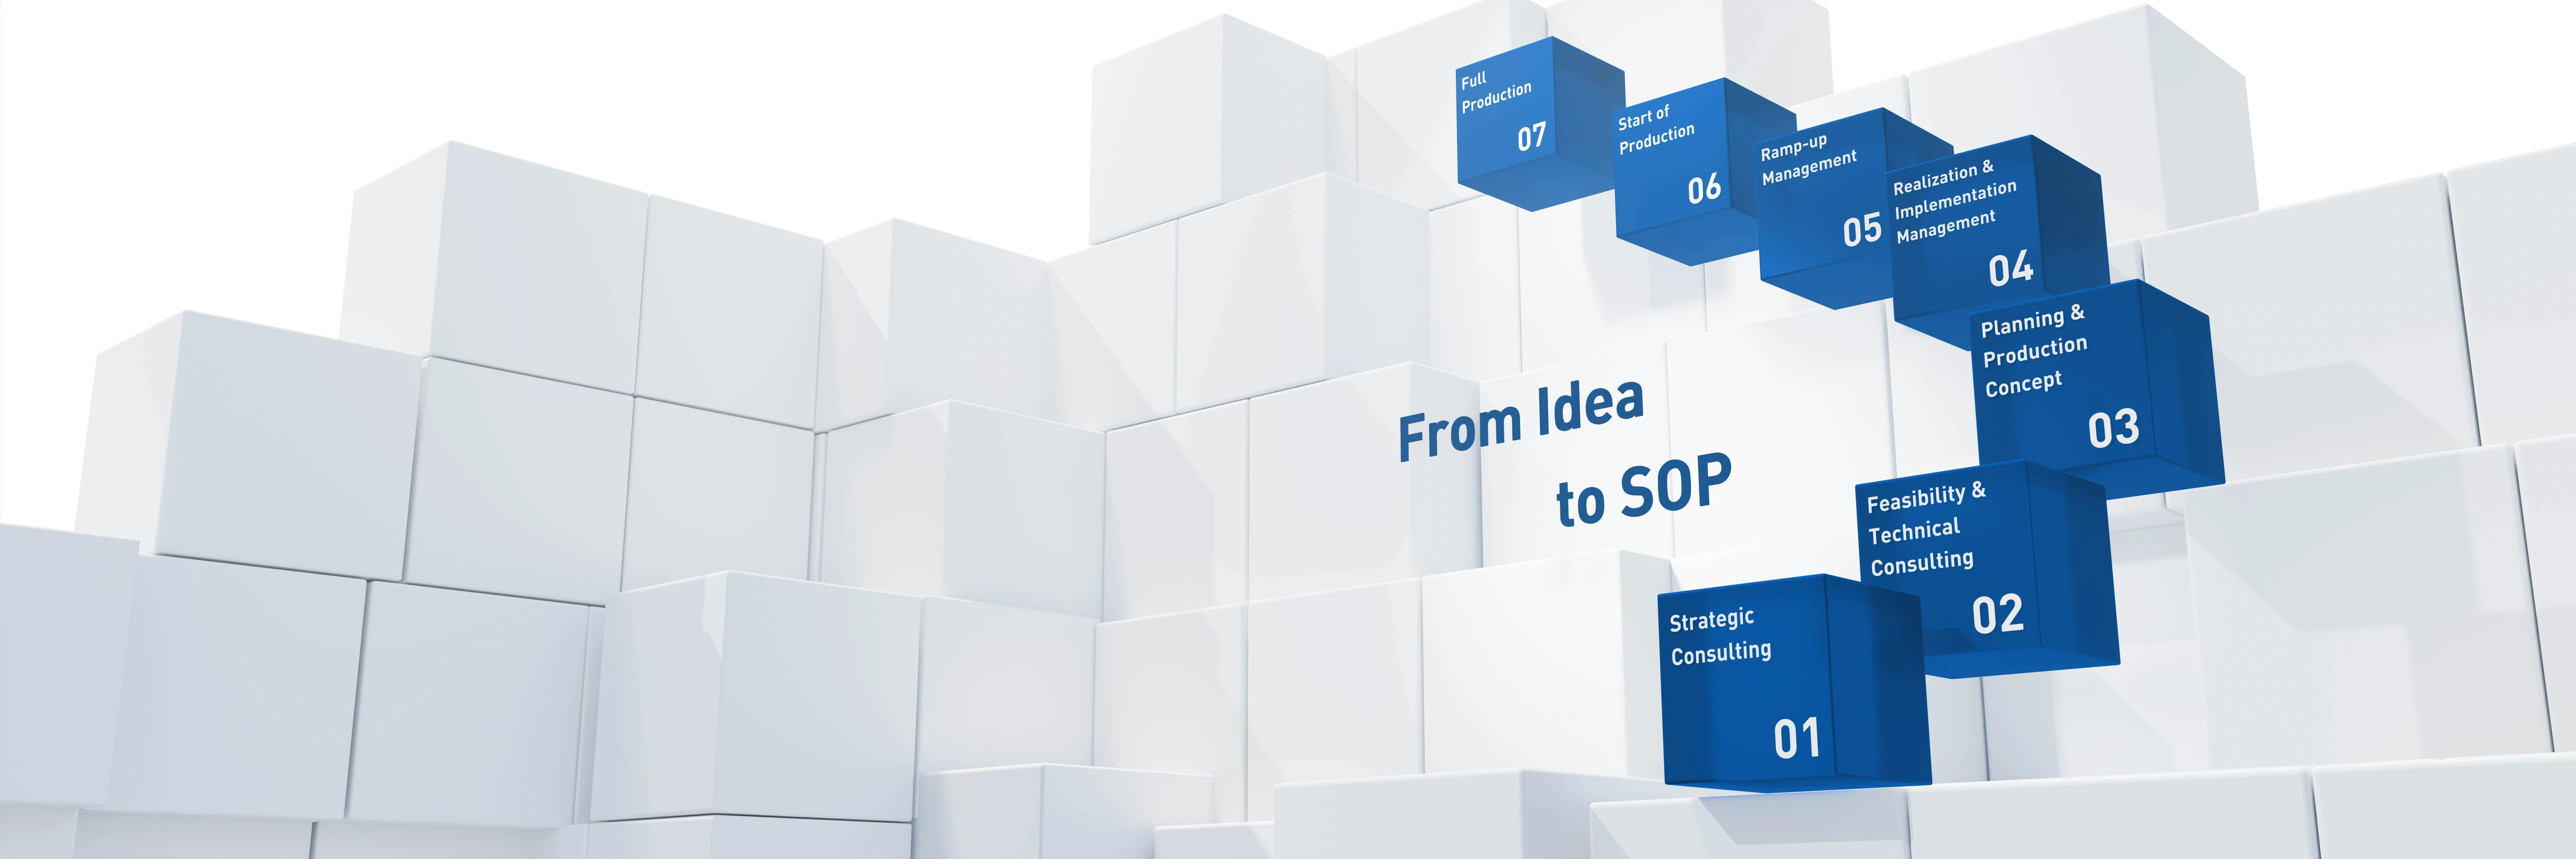
Dürr Consulting
Management & Operations Consulting for automotive & industry sector. Since 1985.
NEXT.assembly
Dürr’s NEXT.assembly provides customers around the world with processes and technologies for optimized final assembly solutions.


Leading in Production Efficiency
Dürr Systems AG is part of the Dürr Group, one of the world's leading mechanical and plant engineering firms with outstanding expertise in the fields of automation and digitization.
The Dürr Group is active on the market with the three main brands Dürr, Schenck, and HOMAG. The long-established brand Dürr has been a byword for continuous innovation since 1896, with a wide range of products in robot, process, and assembly technology for all areas of vehicle production, focusing on painting and final assembly lines.
Dürr also offers painting technology for general industry. Smart automatic and supervisory control systems and an efficient service offering complete the portfolio.


Career at Dürr

Discover the future and shape it at Dürr. Find job opportunities worldwide!
Events
Locations | Contact us!
Here you can activate a map service. This results in a transmission of your data (e.g. IP address) to the respective provider, as explained in our data protection .
Agree
- Dürr represented by: BEMAQ S.A.Panamericana Colectora Este 2011, Oficina 104
B1609JVB Boulogne, Prov. De Buenos Aires
Argentina - Dürr Brasil Ltda.Rua Arnaldo Magniccaro, 500, Vila Gea
04691-060 São Paulo - SP
Brazil - Verind Brasil Serviços & Soluções LtdaAv. Amazonas 1446
32600-324 Brasileia - Betim - MG
Brazil - Durr Systems Canada, Inc.611 Kumpf Drive, Suite 100
N2V 1K8 Waterloo, Ontario
Canada - Dürr Paintshop Systems Engineering (Shanghai) Co., Ltd.No.665 YingShun Road, Qingpu Industrial Park
201799 Shanghai
China - Dürr represented by: Schenck Shanghai Machinery Corp. Ltd., Beijing BranchNo. 1111, Fengxiang Rd. Baoshan district
200444 Shanghai
China - Dürr represented by: Schenck Shanghai Machinery Corp. Ltd., Beijing BranchRoom 1111, SciTech Tower, No. 22, JianGuoMenWai Avenue, Chaoyang District
100004 Beijing
China - Dürr represented by: Kodama s.r.o.Pod. Postou 102
190 15 Praha 9
Czechia - Dürr represented by: Heavy Industries Services Co. 'HISCO'Building 15 Block 1149, 15 Salah Zaki Street
11361 Sheraton Heliopolis/Cairo
Egypt - Dürr Systems S.A.SImmeuble Gaïa - 9 Parc Ariane Boulevard des Chênes
78280 Guyancourt
France - Datatechnic S.A.S.5 Impasse du Stade
88390 Uxegney
France - Dürr SystemsZ.I. des Malines 32 rue des Malines
91090 Lisses
France - Dürr AktiengesellschaftCarl-Benz-Str. 34
74321 Bietigheim-Bissingen
Germany - Dürr Systems AGCarl-Benz-Str. 34
74321 Bietigheim-Bissingen
Germany - iTAC Software AGAubachstr. 24
56410 Montabaur
Germany - Dürr Group Services GmbHCarl-Benz-Str. 34
74321 Bietigheim-Bissingen
Germany - Dürr Assembly Products GmbHKöllner Str. 122 - 128
66346 Püttlingen
Germany - Dürr represented by: Schenck RoTec GmbHLandwehrstraße 55
64293 Darmstadt
Germany - Dualis GmbH IT SolutionBreitscheidstraße 36
01237 Dresden
Germany - Dürr India Private Ltd.471, Prestige Polygon, Anna Salai
600 035, Nandanam, Chennai
India - Universal Acoustic & Emission Technologies Pvt. Ltd.4 Anmol Pride, Survey No. 270/1/16, Baner Road
411045 Pune
India - Dürr represented by: Schenck RoTec India LimitedA-5, Sector 81 Phase - II
201 305 Noida
India - Dürr India Private Ltd.Prestige Polygon, II Floor, 471, Anna Salai, Nandanam
600035 Chennai, Chennai
India - PT Dürr Systems IndonesiaPlaza Summarecon Bekasi, 8th Floor, Unit 801, Jalan Boulevard Ahmad Yani, Blok KA No.1
17142 Bekasi Utara
Indonesia - PT Robotec Ergo Solutions (RES)Jl. Kp. Cibuntu Asem No.20, Cibuntu, Kec. Cibitung
17520 Kabupaten Bekasi, Jawa Barat
Indonesia - Verind S.p.a.Via Papa Giovanni XXIII, 25/29
20053 Rodano (MI)
Italy - Olpidürr S.p.A.Via G. Pascoli, 14
20090 Novegro di Segrate (MI)
Italy - Dürr Systems S.p.A.Via A. Spinelli 4
10092 Beinasco (TO)
Italy - Dürr Systems Italy S.p.A.Via A.Spinelli 4
10092 Beinasco (TO)
Italy - Verind MelfiSP48 Zona Industriale San Nicola
85025 Melfi (PZ)
Italy - Dürr Japan K.K2-14-6 Sakae-cho
273-0018 Funabashi, Chiba
Japan - Dürr Korea Inc.20F., D-Cube City 662, Gyeongin-ro, Guro-gu
08209 Seoul
Korea, Republic of - Dürr Korea Inc.9, Maegoksaneop, Buk-gu
44222 Ulsan
Korea, Republic of - Dürr Systems Malaysia Sdn. Bhd.4, Jalan SS 13/4, Subang Jaya Industrial Estate,
47500 Subang Jaya, Selangor
Malaysia - Dürr de México S.A de C.V.Avenida La Noria No. 168, Parque Industrial Querétaro
76220 Querétaro
Mexico - Dürr represented by: Carl Schenck Machines en Installat. B.V.Schiedamsedijk 81 a
3011EM Rotterdam
Netherlands - Dürr Systems Arabia LLCPrince Saud al Faisal Street, Rovan Tower
23433 Jeddah, Al Rawdah District
Saudi Arabia - Dürr represented by: DS - Slovakia, s.r.o Business Office BratislaveMedved'ovej 19
851 04 Bratislava
Slovakia - Dürr Africa (Pty) Ltd.33 Roshan Street Framesby
6045 Port Elizabeth
South Africa - Dürr Systems Spain, S.A.U.C/ Zuatzu 8, Planta 2ª Parque Empresarial Zuatzu - Edificio Oria
20018 Donostia San Sebastián
Spain - Dürr Systems Spain, S.A.U.C/ Antonio Machado 78-80, Planta baja; Viladecans Business Park - Edificio Australia
08840 Viladecans
Spain - Dürr represented by: Turn Luckily Technology Co. Ltd.5th Floor, 93 Hsin-Sheng South Road Sec.1
10626 Taipei
Taiwan, Province of China - Dürr (Thailand) Co., Ltd.631 Media Gallery Building, 2nd Floor, Nonsee Rd., Chongnonsee, Yannawa
10120 Bangkok
Thailand - Dürr represented by: Scalar Technology Co. Ltd.128/73 Phyathai Plaza Building, 7th floor, Phyathai Rd. Thung-Phyathai
10400 Bangkok
Thailand - Dürr Systems Ltd. SirketiSahil Mahallesi D-130 Karayolu Caddesi No: 45/4
41030 Basiskele / Kocaeli
Türkiye - Dürr represented by: Dürr Systems – Schenck Branch OfficeHukukçular Towers A Blok No:35
34758 Kartal / Istanbul
Türkiye - Dürr Limited - WarringtonLakeview 600 Lakeside Drive
WA1 1RW Warrington
United Kingdom - Dürr Limited - LeicestershireBarleyfield Hinckley
LE10 1YE Leicestershire
United Kingdom - Dürr represented by: Schenck LimitedBroxell Close
CV34 5QF Warwick
United Kingdom - Dürr Systems LLC26801 Northwestern Highway
48033 Southfield, MI
United States - Dürr Systems LLC - De Pere830 Prosper Street
54115 De Pere, WI
United States - Dürr represented by: Schenck USA Corporation26801 Northwestern Highway
MI 48033 Southfield
United States - Dürr Systems LLC - Ford BlueOval City
- Durr Vietnam Co., Ltd.Room LA.02-04, 2nd Floor, Block A, Lexington Residence Building, No. 67 Mai Chi Tho Street, An Phu Ward, District 2
700000 Ho Chi Minh City
Viet Nam